HSIE Teachers
  • Home
  • Blog
  • 11 Geography
    • Earth's Natural Systems >
      • Key Terms
      • Processes, cycles and circulations >
        • Atmospheric systems
        • Hydrological systems >
          • Georges River Introduction
          • Georges River
          • Georges River Fieldwork
          • Water Management
          • Flow of Water Though Catchments
          • Catchments - Key Terms
          • Murray-Darling Catchment
          • Human impacts on hydrological processes
        • Geomorphic systems
        • Ecological systems
    • People, Patterns and Processes >
      • Population and resource consumption >
        • Demographic processes
        • Demographic processes - Mortality
        • Population pyramids
        • Challenges of changing population
    • Human-Environment Interactions >
      • A contemporary hazard >
        • Volcanic Eruptions
        • Floods 2022
        • COVID-19
        • Bushfire 2019-2020 >
          • Spatial distribution
          • Managing a contemporary hazard
  • 12 Geography (from 2025)
    • Global Sustainability >
      • Pillars of Sustainability
      • Evaluating Sustainability
      • Tourism - Nature and Spatial Patterns
      • Tourism - Influences >
        • Biophsical Influences
        • Ecological Influences
        • Economic Influences
        • Socio-Cultural Influences
        • Political Influences
        • Organisational Influences
        • Technological Influences
      • Tourism - Trends and Future Directions
      • Tourism - Sustainability >
        • Impacts of Tourism
        • Tourism in Venice
    • Urban and Rural Places >
      • One urban place - Ashbury (suburb) >
        • Ashbury - location and character
        • Ashbury - changes
        • Ashbury - responses to changes
    • Ecosystems and Global Biodiversity >
      • Coral Triangle
  • Geographical Tools
    • Tools Checklist
    • Maps >
      • Topo map basics
      • Area and Grid Reference
      • Sight Lines
      • Bearing
      • Gradient
      • Cross Section
      • Vertical Exaggeration
      • Sketch Maps
      • Synoptic Charts
      • Latitude and Longitude
    • Geographical Inquiry >
      • Soil characteristics
      • Vegetation Profile
      • Fieldsketch
      • Water Quality
      • Microclimate Fieldwork
    • Graphs and Statistics

Population Pyramids

​Key terms:
Population structure
Dependency ratio

Population pyramids show the age and gender structure of a population. They can be used to predict what will happen in the future and predict what services may be needed. 

· Population pyramids are an important tool used in demography. 
· Age distribution of the population can be seen at a glance.

A country with a broad, wide base:
· has a very high birth rate
· has very young population
· needs schools, baby health centres, support for families and mothers

A country with large groups of older people:
· needs retirement homes
· recreational activities for older people
· money to pay old age pensions or alternate polcies to address the social and economic needs of the elderly.

The dependency ratio of a population refers to the percentage of the population which is over 65 together with those under 15. Together, this part of the population is considered to be out of the work force and therefore they must be supported by the rest of the population.  
How to draw a population pyramid:

  1. Draw a horizontal axis and add the scale. Remember to start in the middle with your scale and represent the males on the left and the females on the right.
  2. Draw two lines in the centre of the graph as your vertical axis. Label the age groups starting with 0-4 years and then increasing in 5 year age groups up the graph.
  3. Using the data plot the bars with data for males on the left and data for females on the right. Don’t forget to label your graph!
Picture
Picture
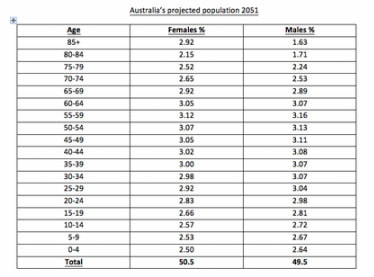
Task: Using the data from the table below: (Use grid paper)

(i) Graph the data on a population pyramid; use a RED pen to graph the data for males and a BLUE pen to graph the data for females.
(ii) Which age group is likely to be the largest in 2051?
(iii) What facilities will they need?
(iv) What implications do you think the data would have for the nature of Australian society?
(v) Which age group will you belong to? How do you think you will be contributing to society?

Note: Select an appropriate scale for your graph! Consider whether the data is on percentage (%) or real figures(e.g. ‘000s)
​
Picture
Accessing global population pyramids
Populationpyramids.net allows you to examine population pyramids of countries from 1950 to present, and predictions into 2100. 
Examine Populationpyramids...
Powered by Create your own unique website with customizable templates.
  • Home
  • Blog
  • 11 Geography
    • Earth's Natural Systems >
      • Key Terms
      • Processes, cycles and circulations >
        • Atmospheric systems
        • Hydrological systems >
          • Georges River Introduction
          • Georges River
          • Georges River Fieldwork
          • Water Management
          • Flow of Water Though Catchments
          • Catchments - Key Terms
          • Murray-Darling Catchment
          • Human impacts on hydrological processes
        • Geomorphic systems
        • Ecological systems
    • People, Patterns and Processes >
      • Population and resource consumption >
        • Demographic processes
        • Demographic processes - Mortality
        • Population pyramids
        • Challenges of changing population
    • Human-Environment Interactions >
      • A contemporary hazard >
        • Volcanic Eruptions
        • Floods 2022
        • COVID-19
        • Bushfire 2019-2020 >
          • Spatial distribution
          • Managing a contemporary hazard
  • 12 Geography (from 2025)
    • Global Sustainability >
      • Pillars of Sustainability
      • Evaluating Sustainability
      • Tourism - Nature and Spatial Patterns
      • Tourism - Influences >
        • Biophsical Influences
        • Ecological Influences
        • Economic Influences
        • Socio-Cultural Influences
        • Political Influences
        • Organisational Influences
        • Technological Influences
      • Tourism - Trends and Future Directions
      • Tourism - Sustainability >
        • Impacts of Tourism
        • Tourism in Venice
    • Urban and Rural Places >
      • One urban place - Ashbury (suburb) >
        • Ashbury - location and character
        • Ashbury - changes
        • Ashbury - responses to changes
    • Ecosystems and Global Biodiversity >
      • Coral Triangle
  • Geographical Tools
    • Tools Checklist
    • Maps >
      • Topo map basics
      • Area and Grid Reference
      • Sight Lines
      • Bearing
      • Gradient
      • Cross Section
      • Vertical Exaggeration
      • Sketch Maps
      • Synoptic Charts
      • Latitude and Longitude
    • Geographical Inquiry >
      • Soil characteristics
      • Vegetation Profile
      • Fieldsketch
      • Water Quality
      • Microclimate Fieldwork
    • Graphs and Statistics